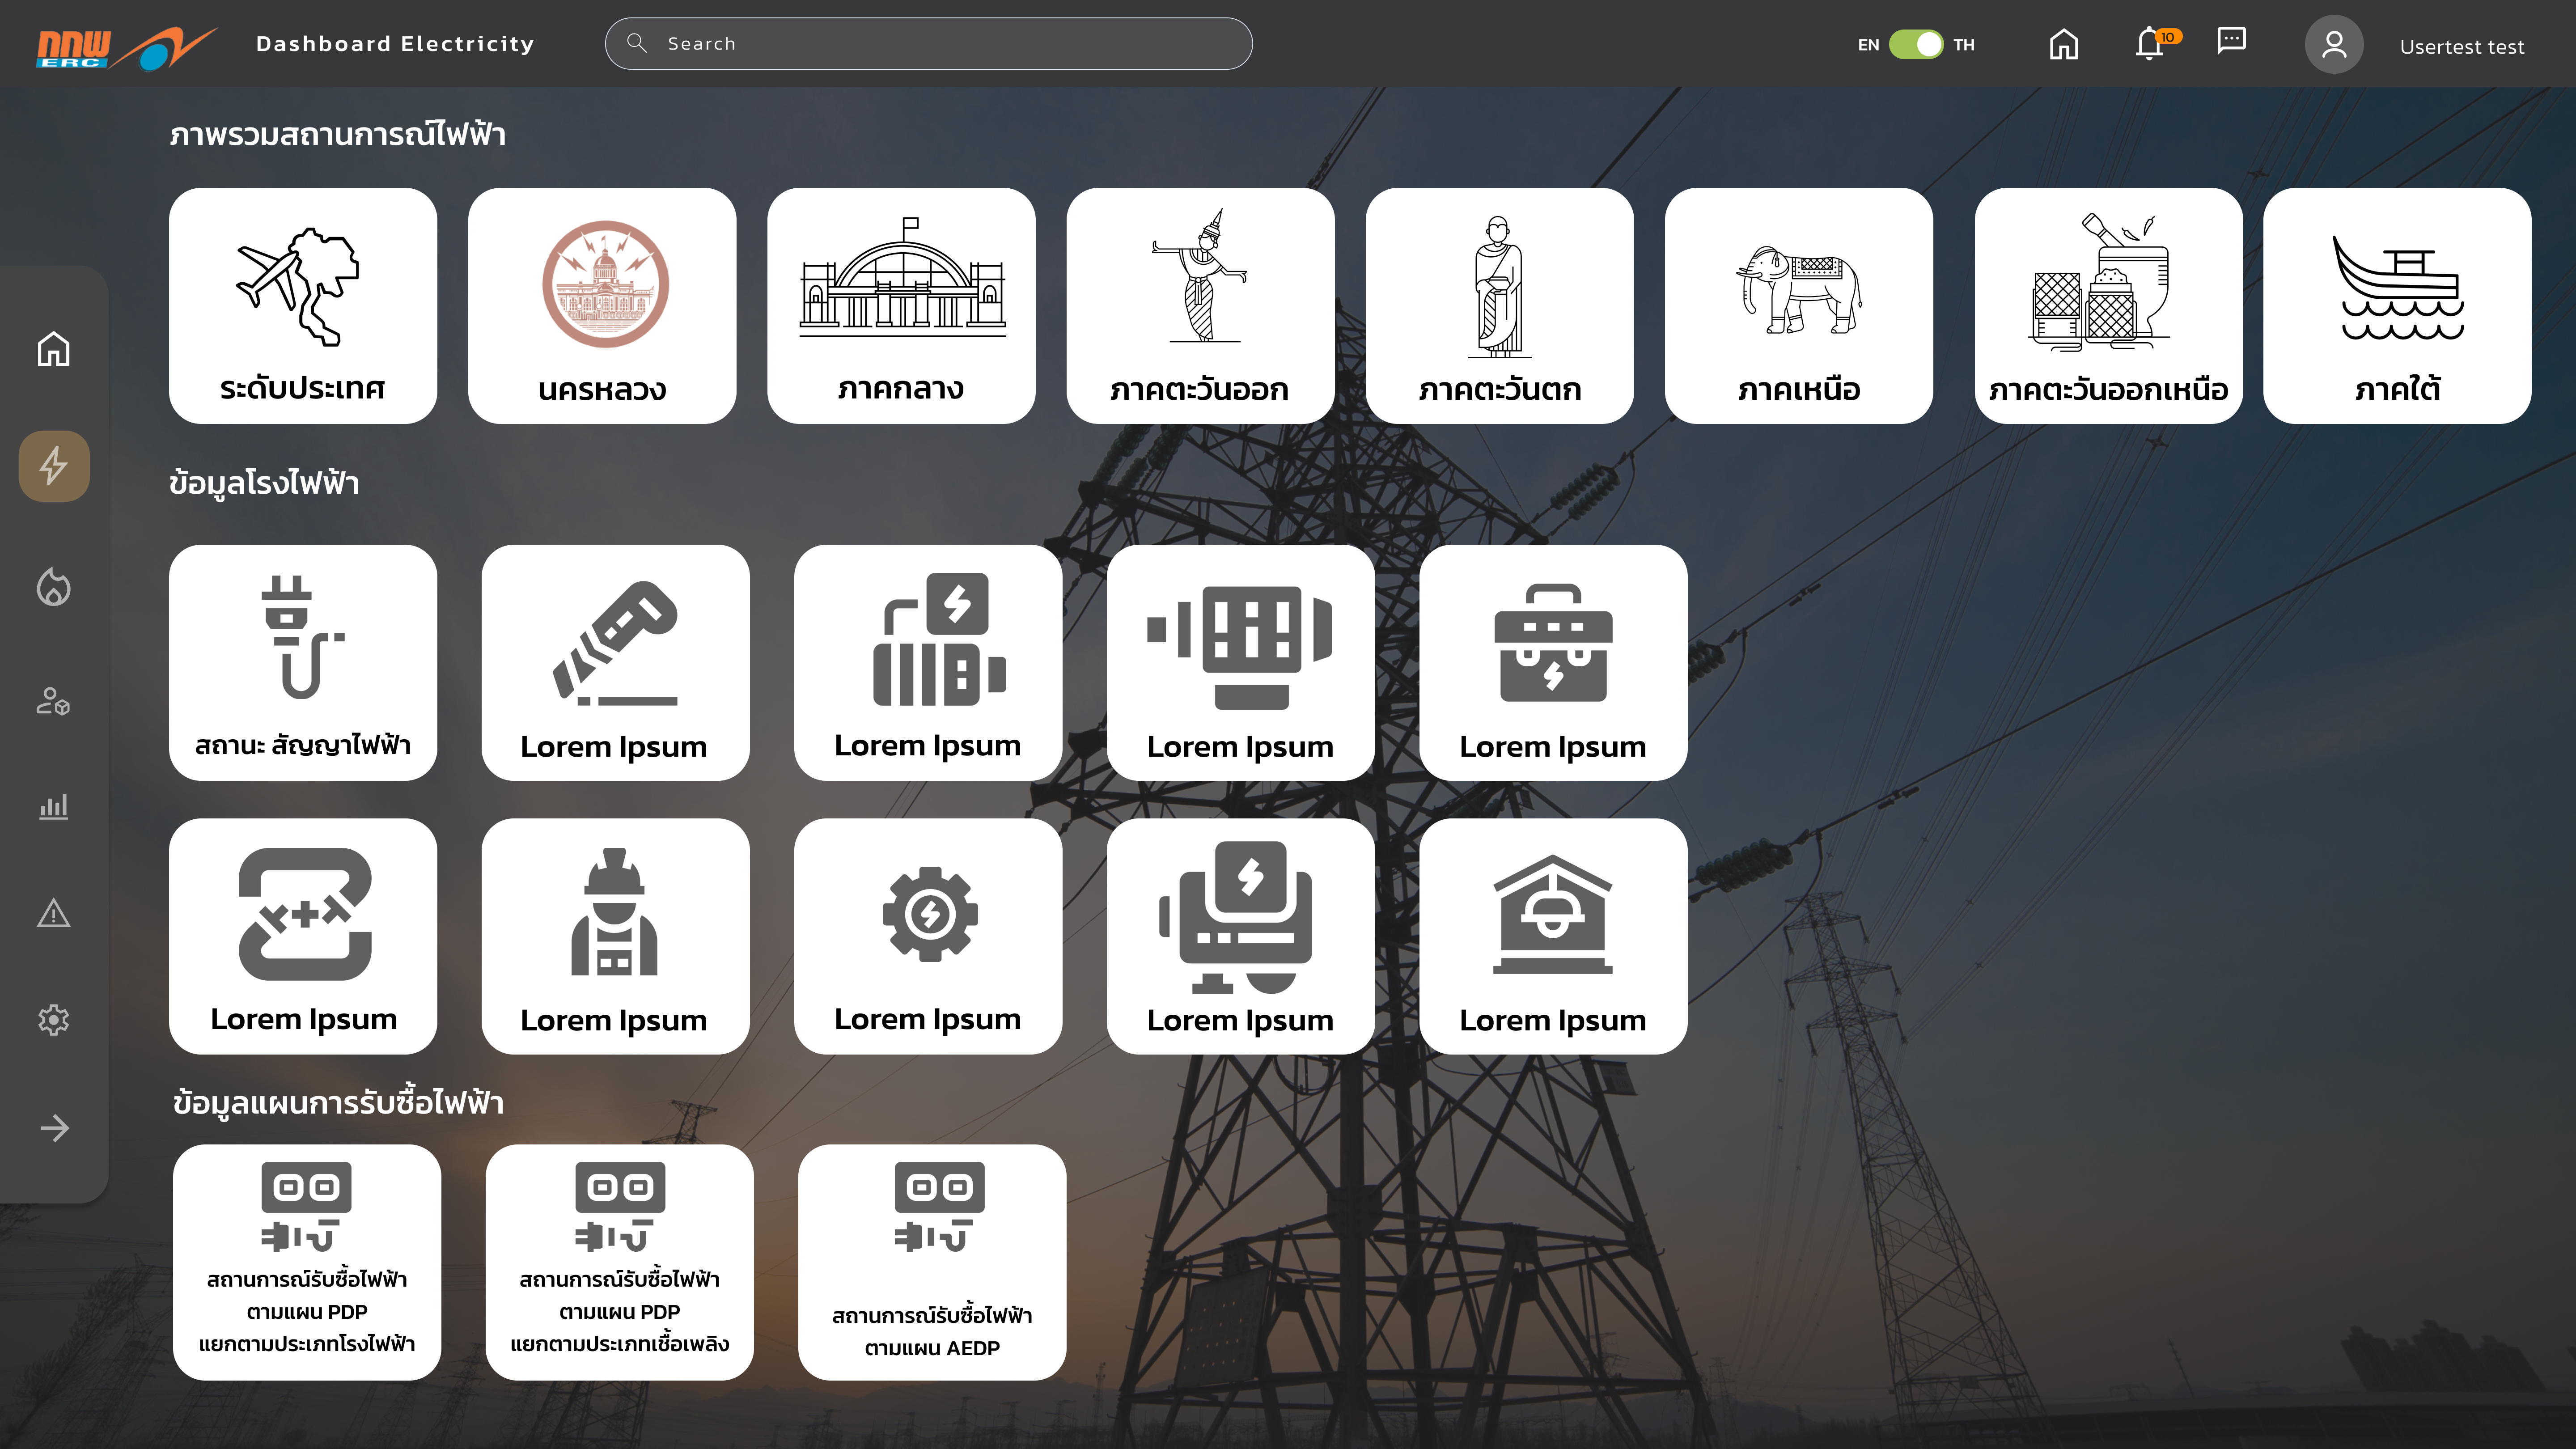
ERC Dashboard (2024)
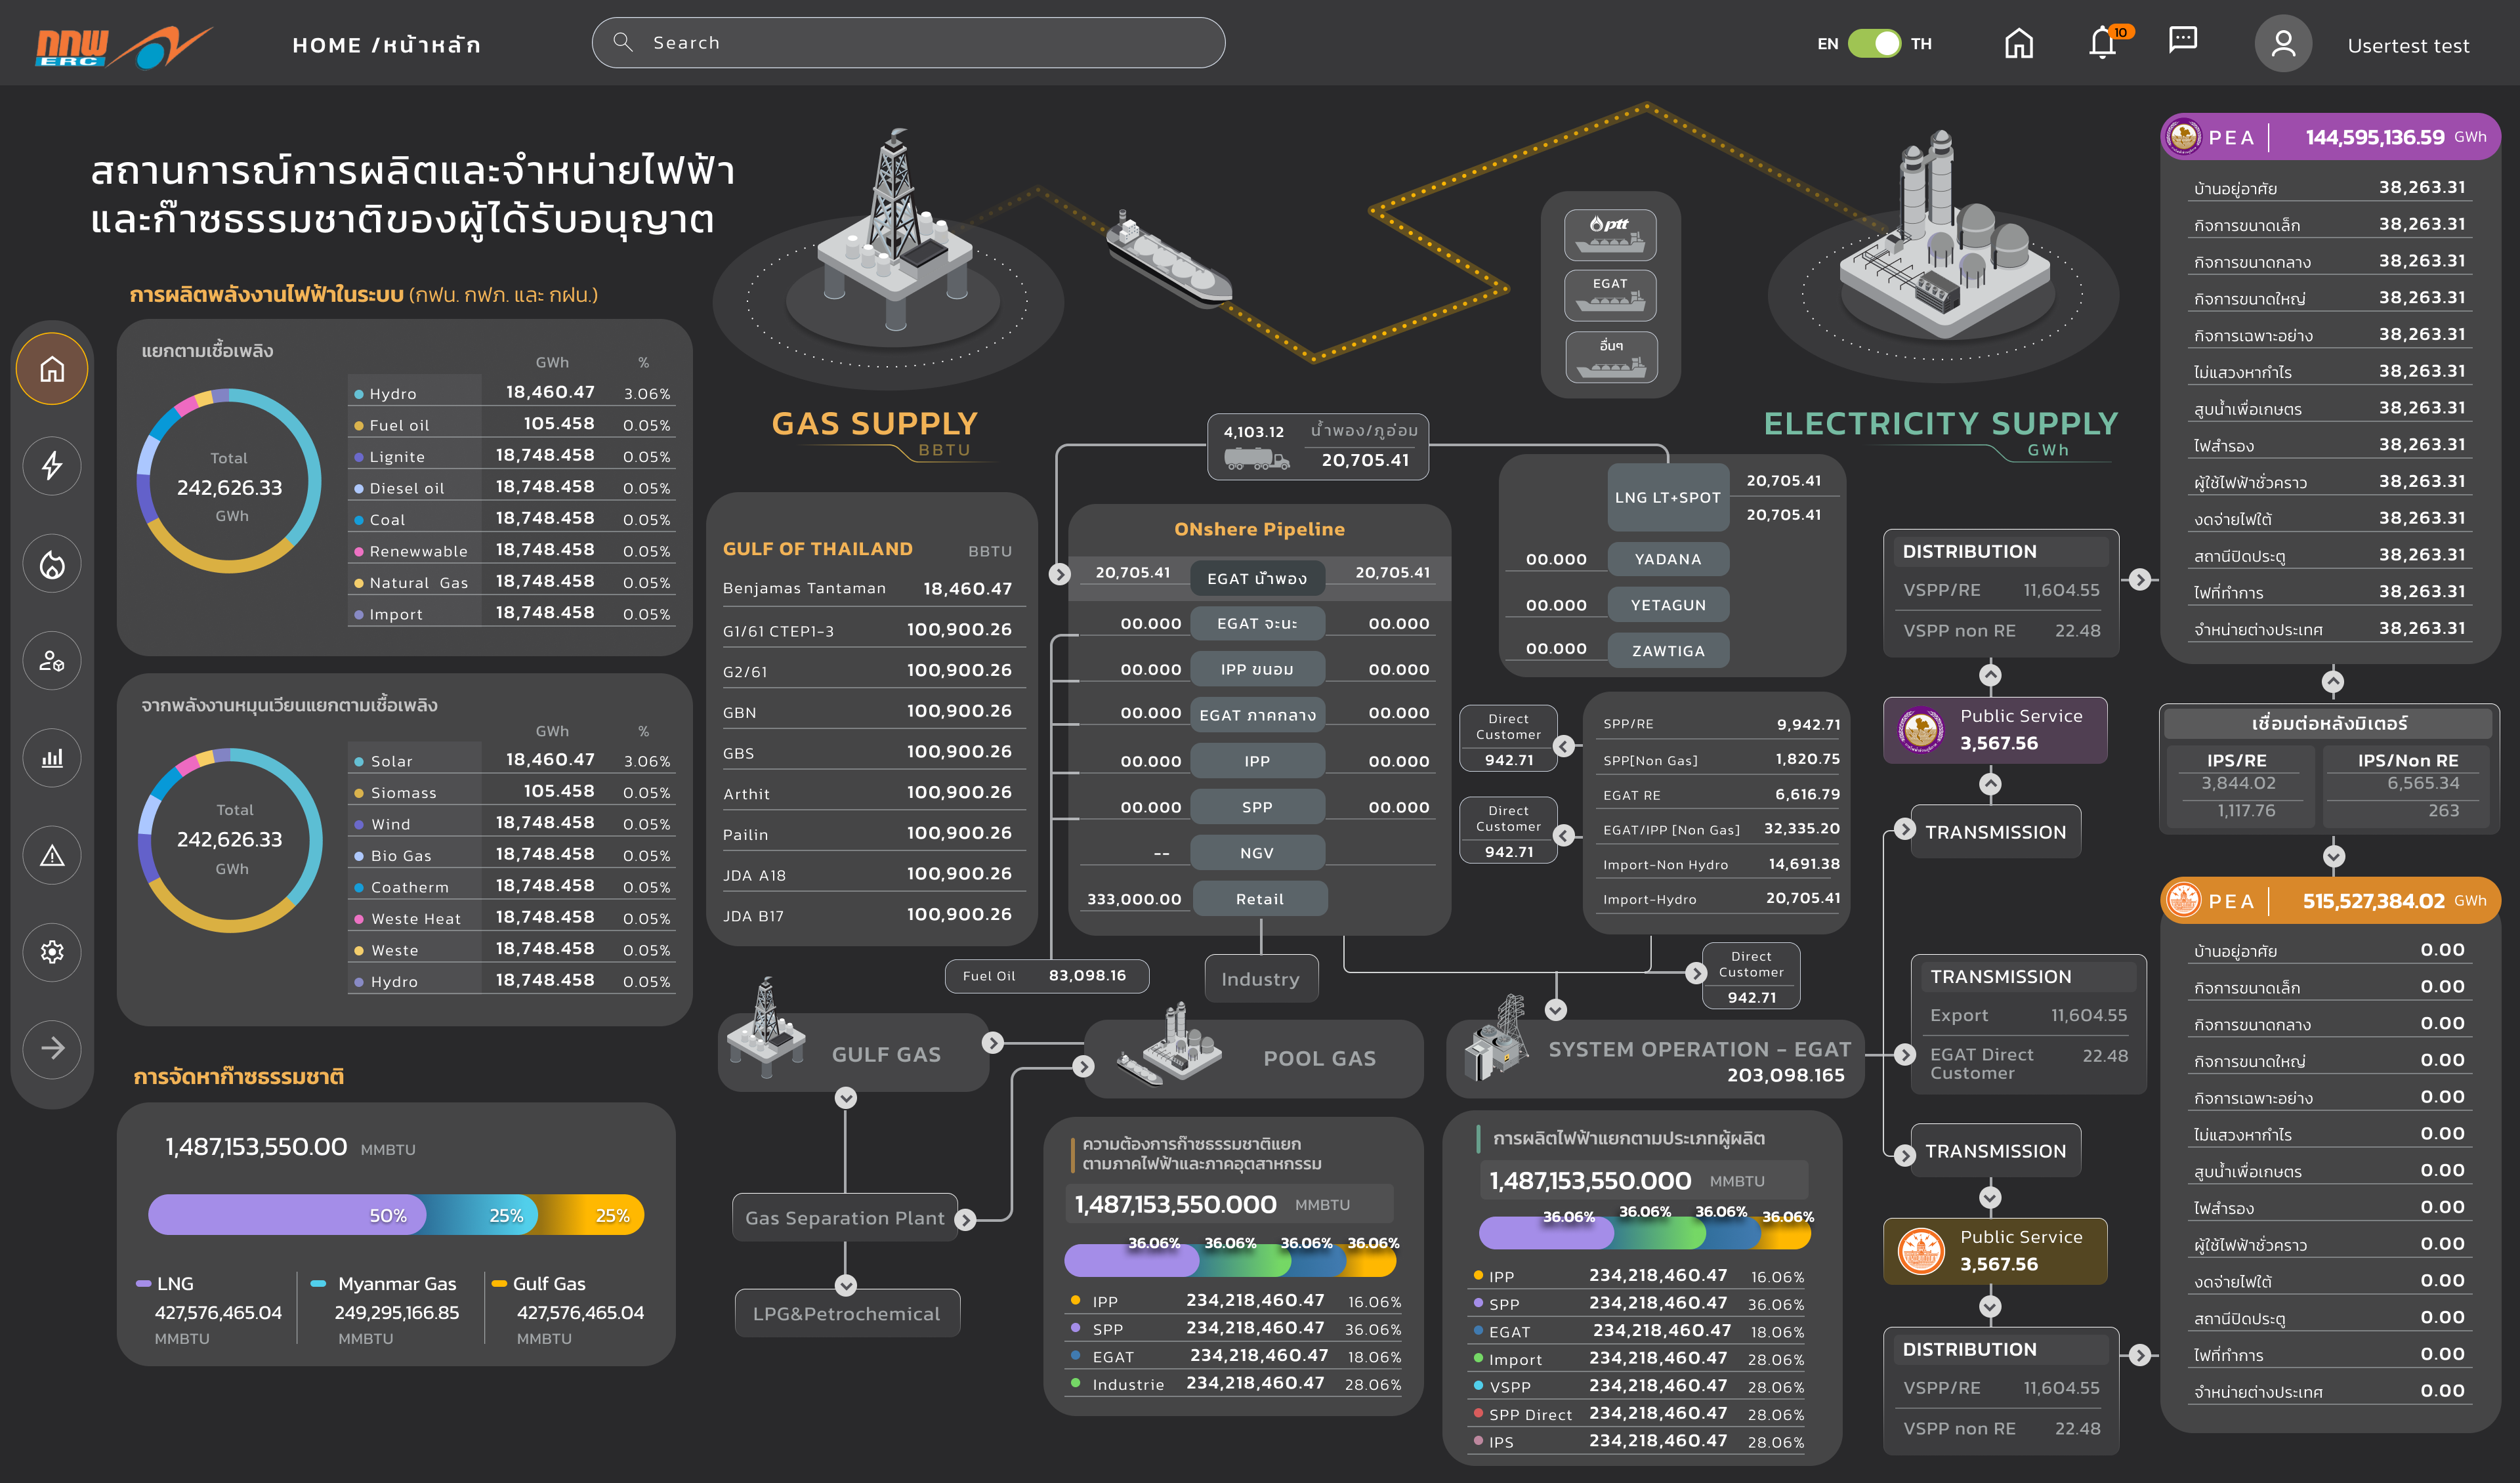
Overview of the ERC Dashboard Project:
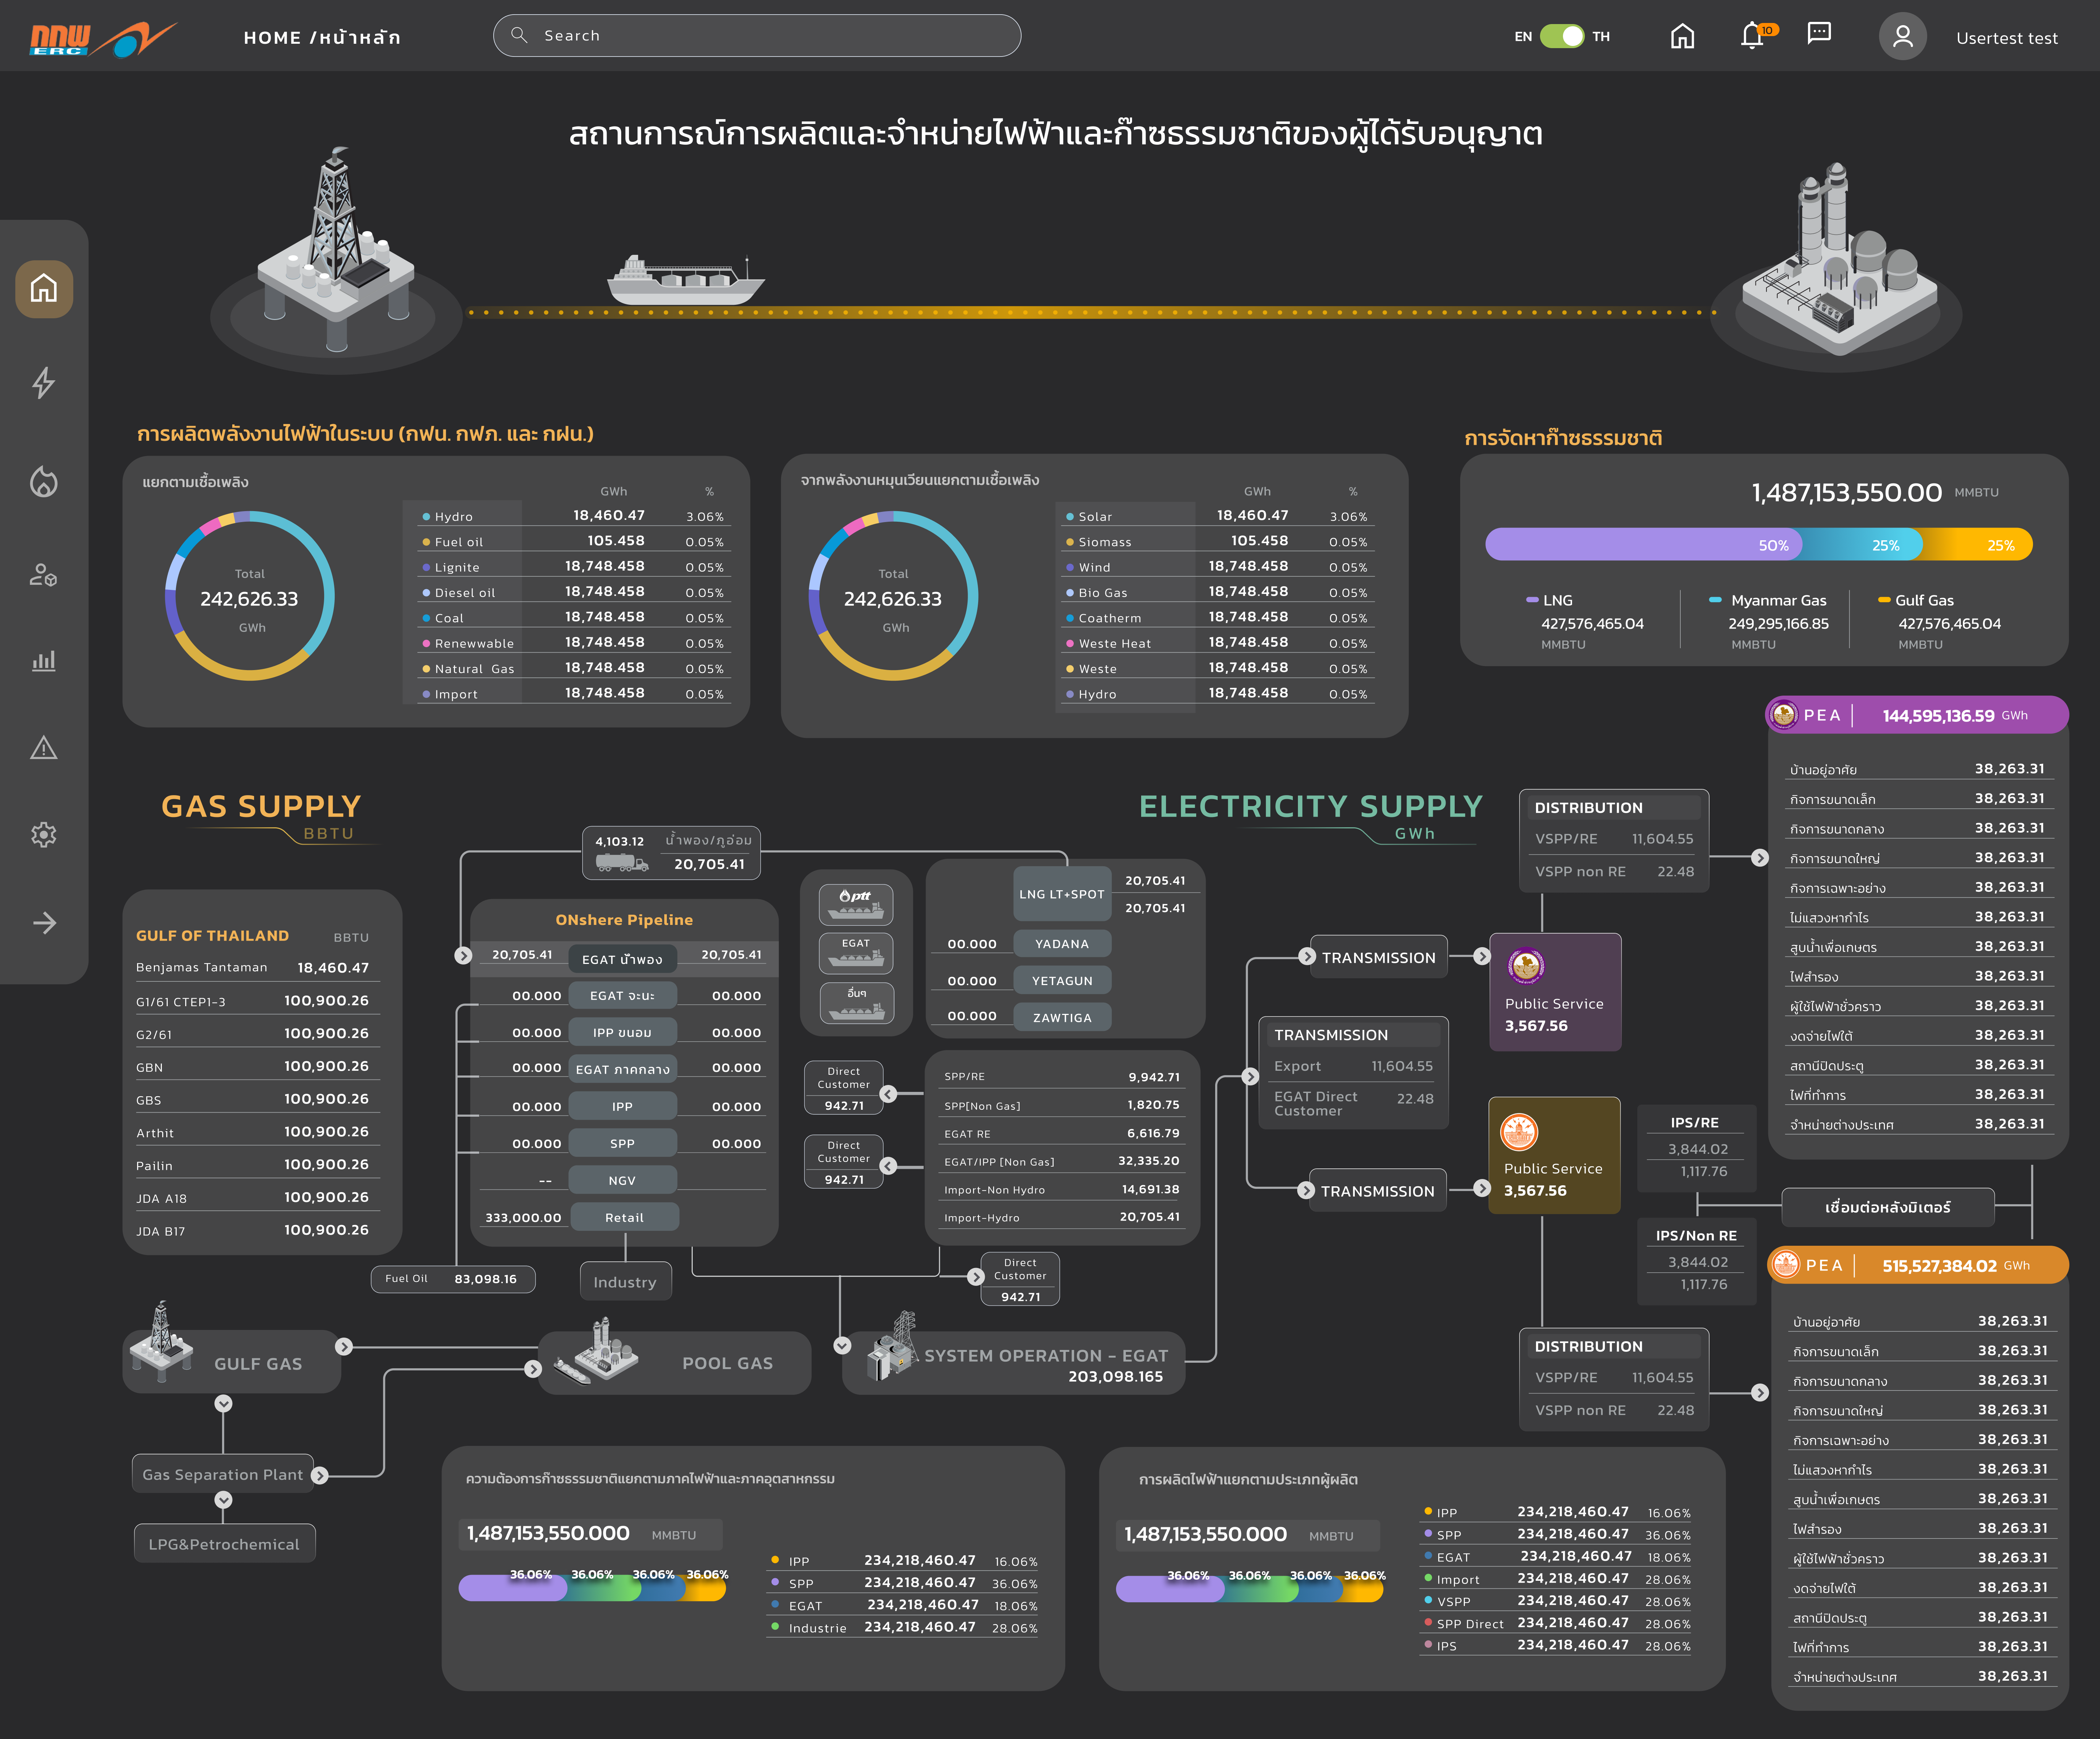
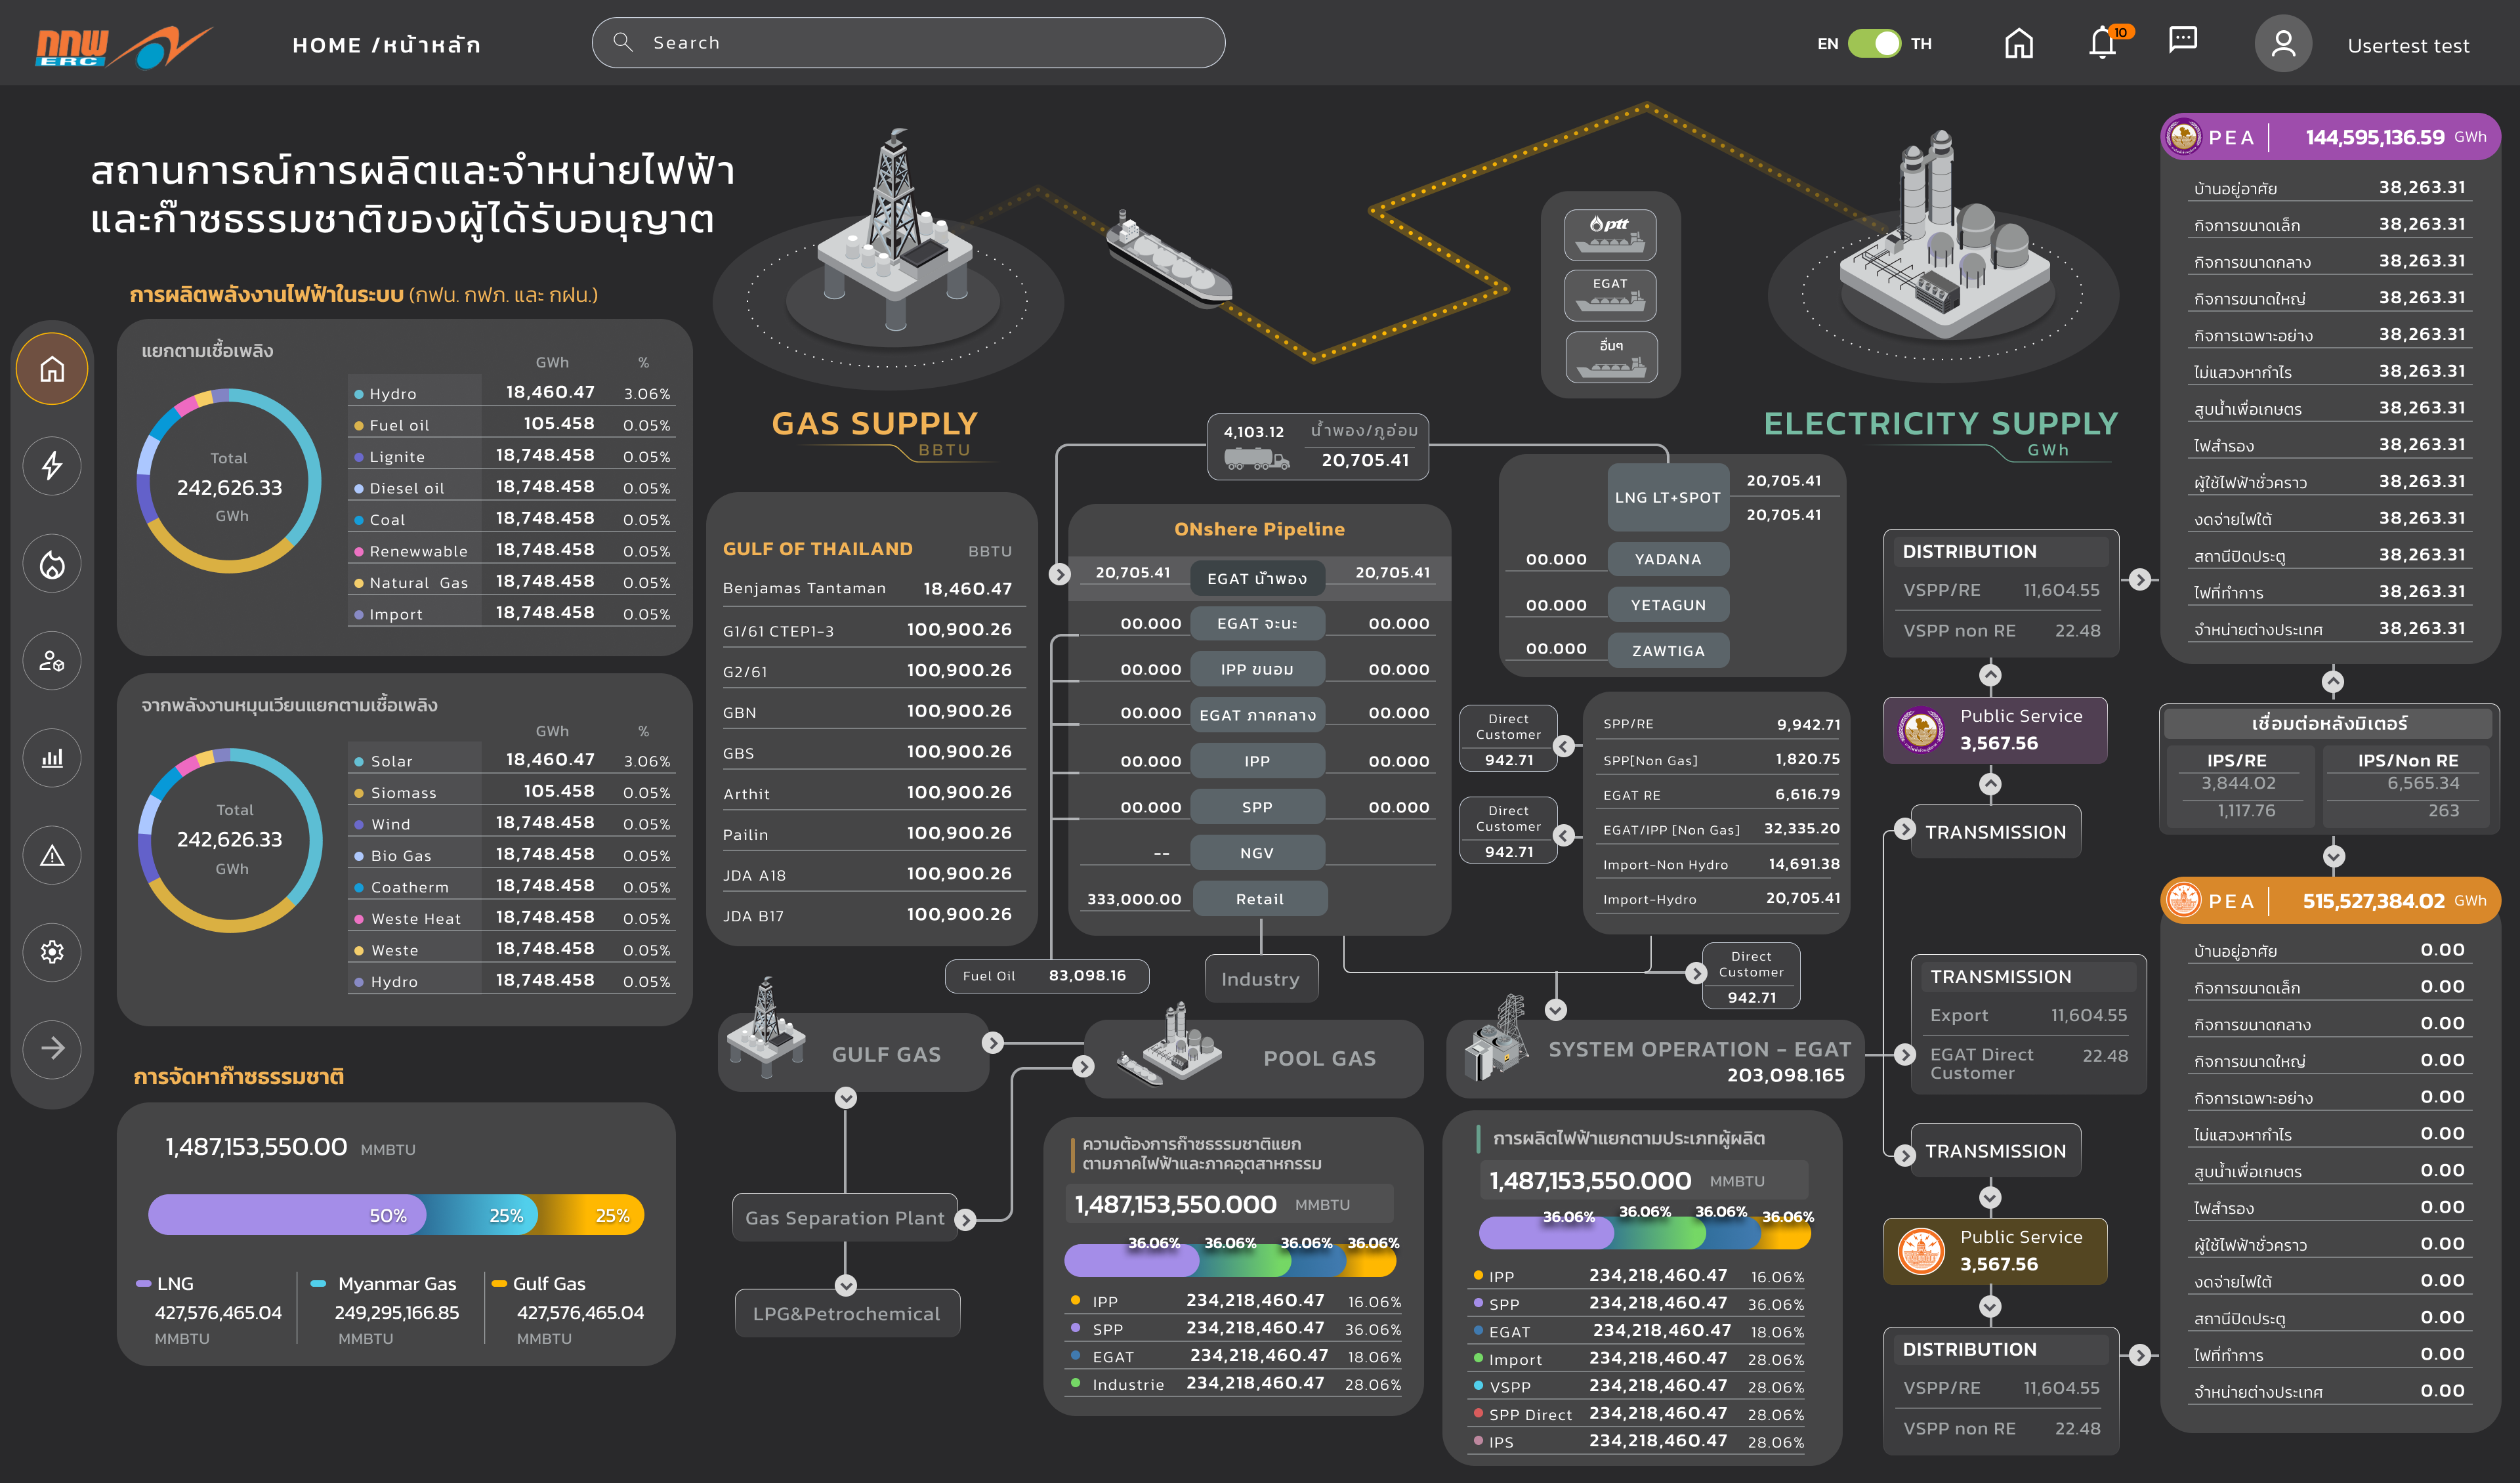
The ERC Dashboard is designed to consolidate key information on the production and distribution of both electricity and natural gas in a clear and easily accessible manner. It aims to support regulatory bodies, energy providers, and consumers in tracking energy usage, resource distribution, and overall energy supply management.
Problem Statement:
The current process of monitoring and managing Thailand’s electricity and natural gas supply is fragmented and inefficient, relying on disparate data sources, manual data compilation, and slow communication between departments. This leads to delays in decision-making, increased risk of outages, and challenges in integrating renewable energy sources into the grid.
Stakeholders, including regulatory bodies such as the Energy Regulatory Commission (ERC), electricity operations teams, and energy analysts, lack a unified platform that provides real-time data, interactive visualizations, and automated reporting tools to effectively manage energy supply, distribution, and consumption. Additionally, balancing the growing demand for energy with sustainable practices remains difficult due to the absence of forecasting and load-balancing capabilities that account for both traditional and renewable energy sources.
Without an efficient, data-driven solution, energy providers risk inefficiencies in supply management, decreased grid reliability, and slower response times to power disruptions, which could impact Thailand’s energy goals and overall economic growth.
Key Features:
- Gas and Electricity Supply Breakdown:
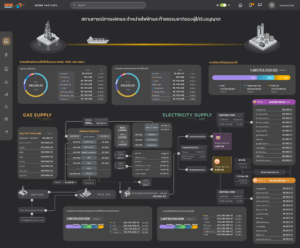
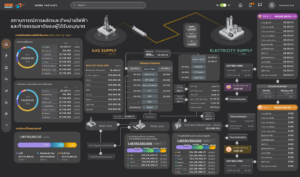
- The dashboard displays the total supply and distribution of gas and electricity, providing insights into various energy sources, including renewable and non-renewable options (e.g., hydro, coal, natural gas, wind, solar).
- Energy Consumption and Allocation:
- The system tracks the flow of natural gas from supply sources such as the Gulf of Thailand and imports (LNG), showing its transportation via pipelines to power plants (EGAT and IPP) and other sectors.
- Electricity consumption is divided into public services, industrial sectors, and transmission networks, giving a complete view of energy distribution.
- Real-Time Monitoring and Efficiency:
- The dashboard includes up-to-date data on fuel consumption, gas imports, and energy transmission, helping stakeholders ensure efficient energy management across regions and industries.
- Interactive Data Visualization:
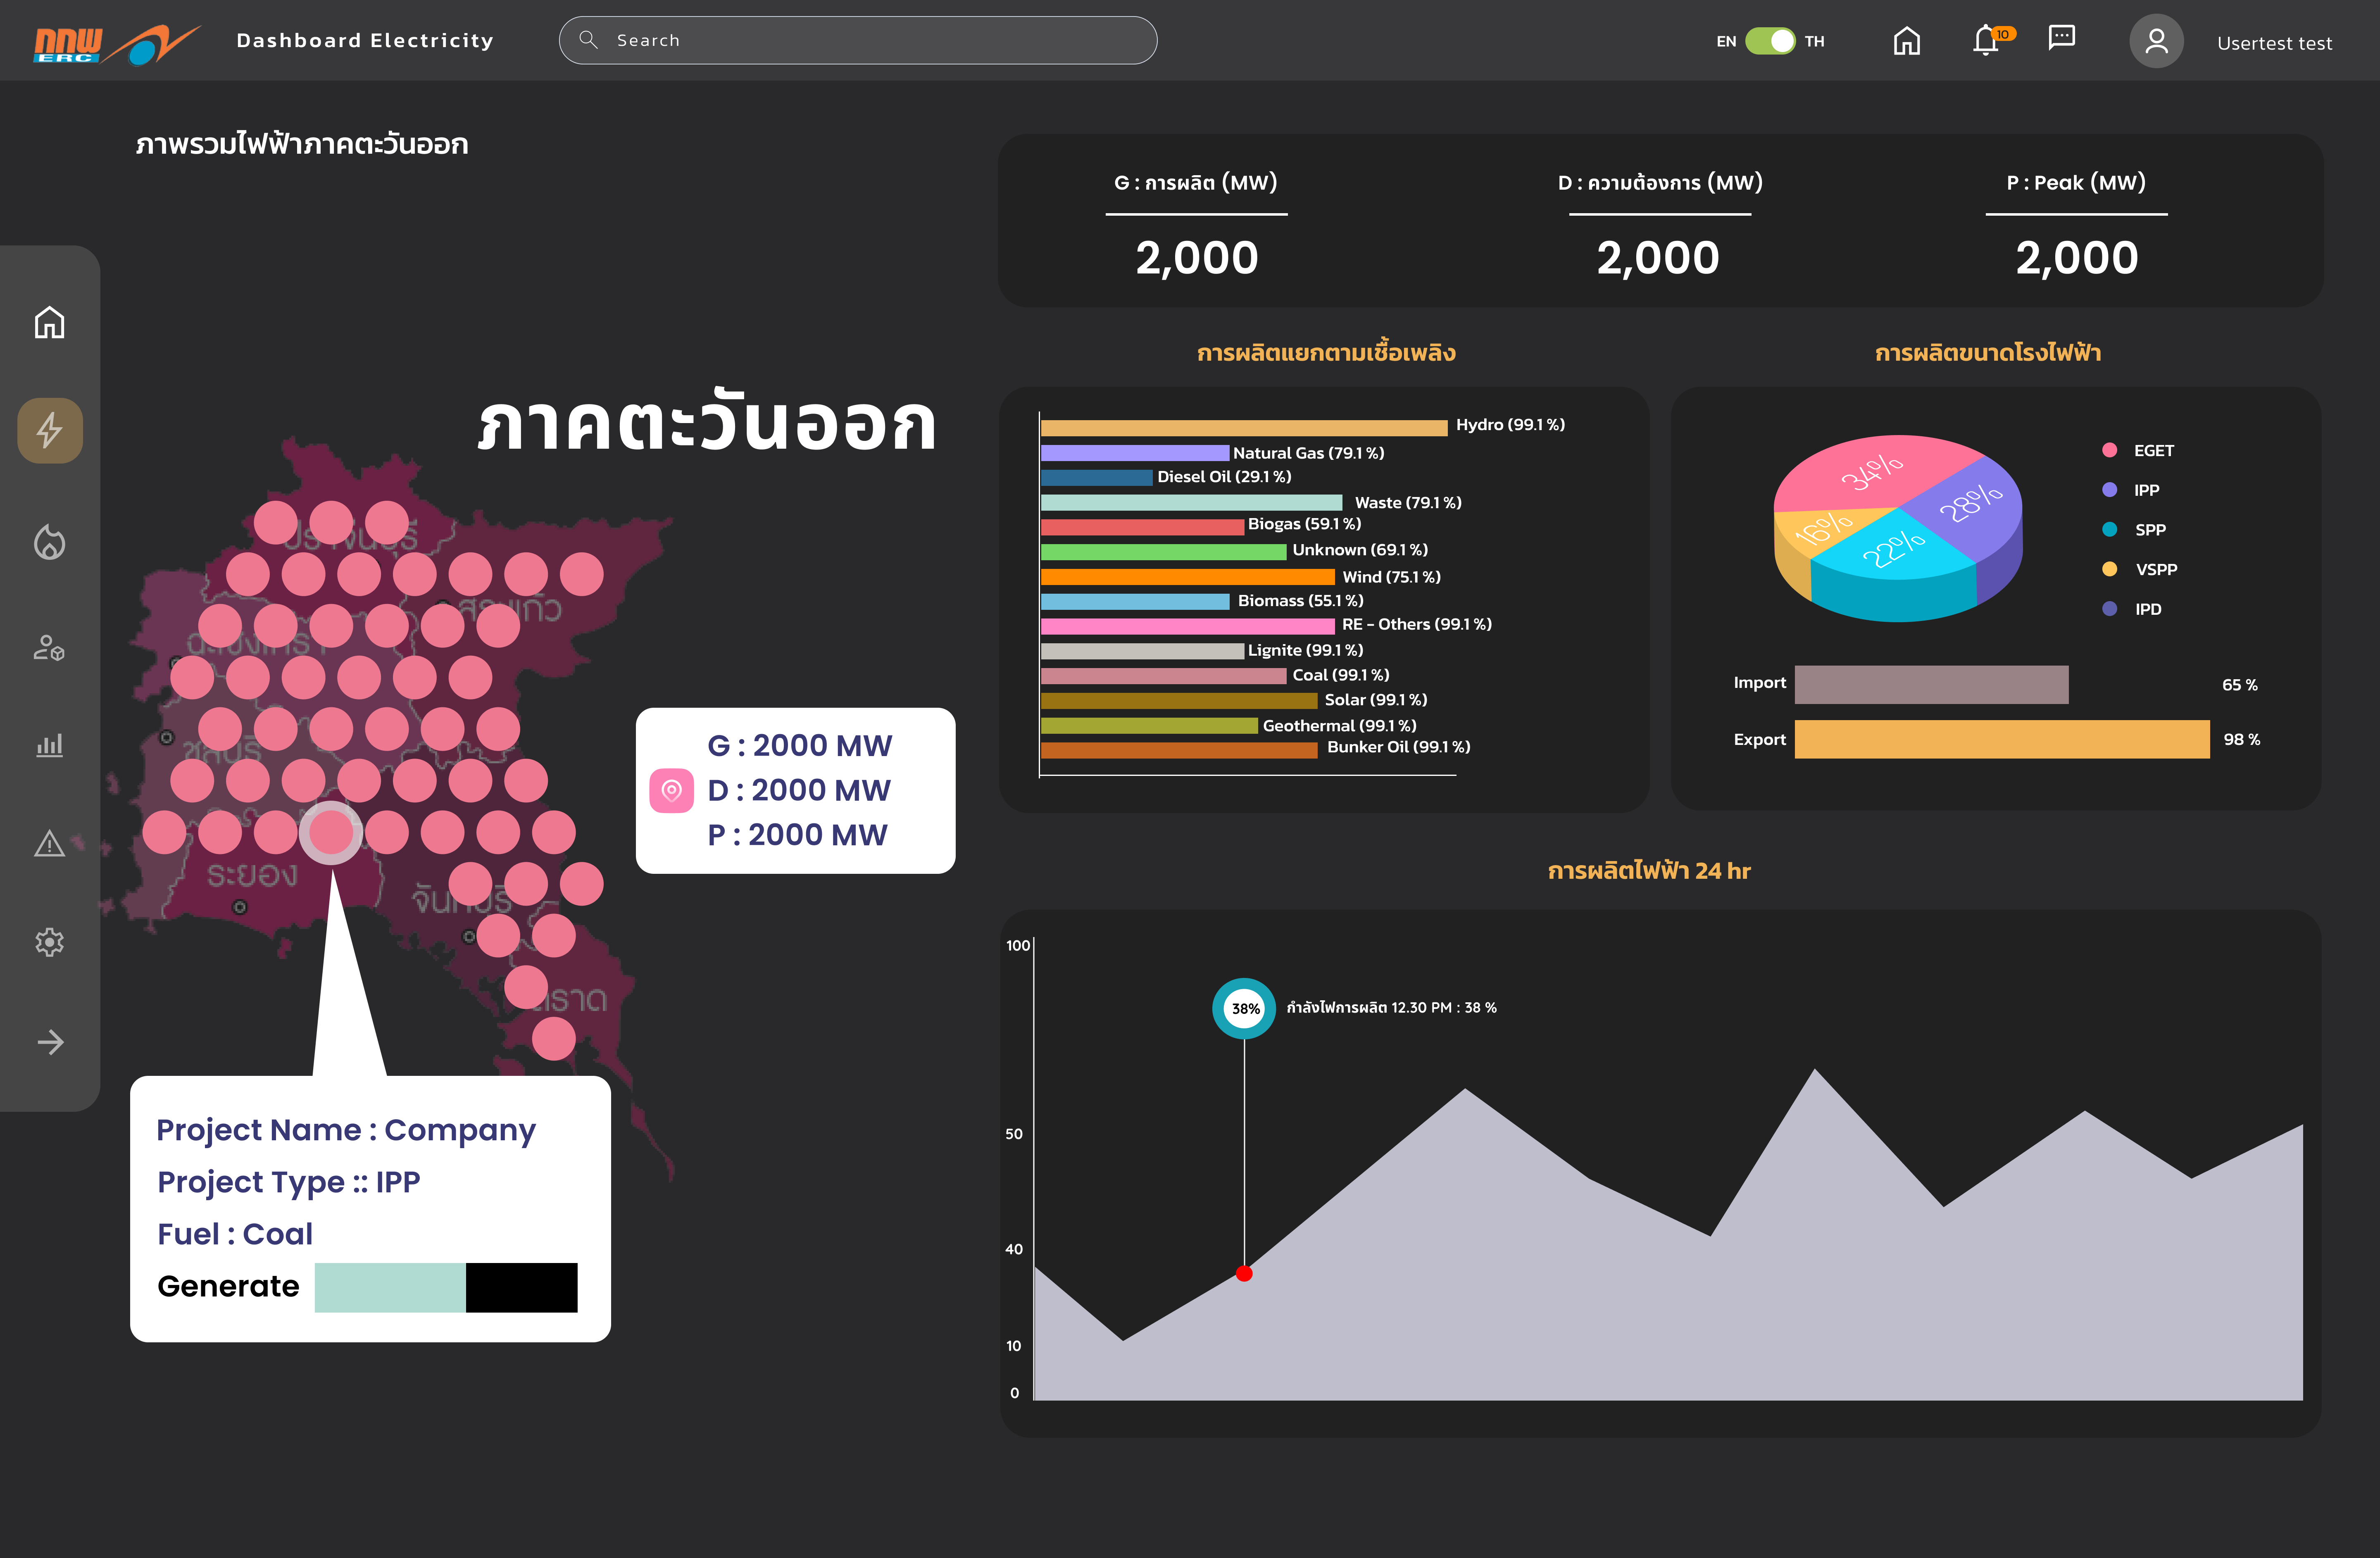
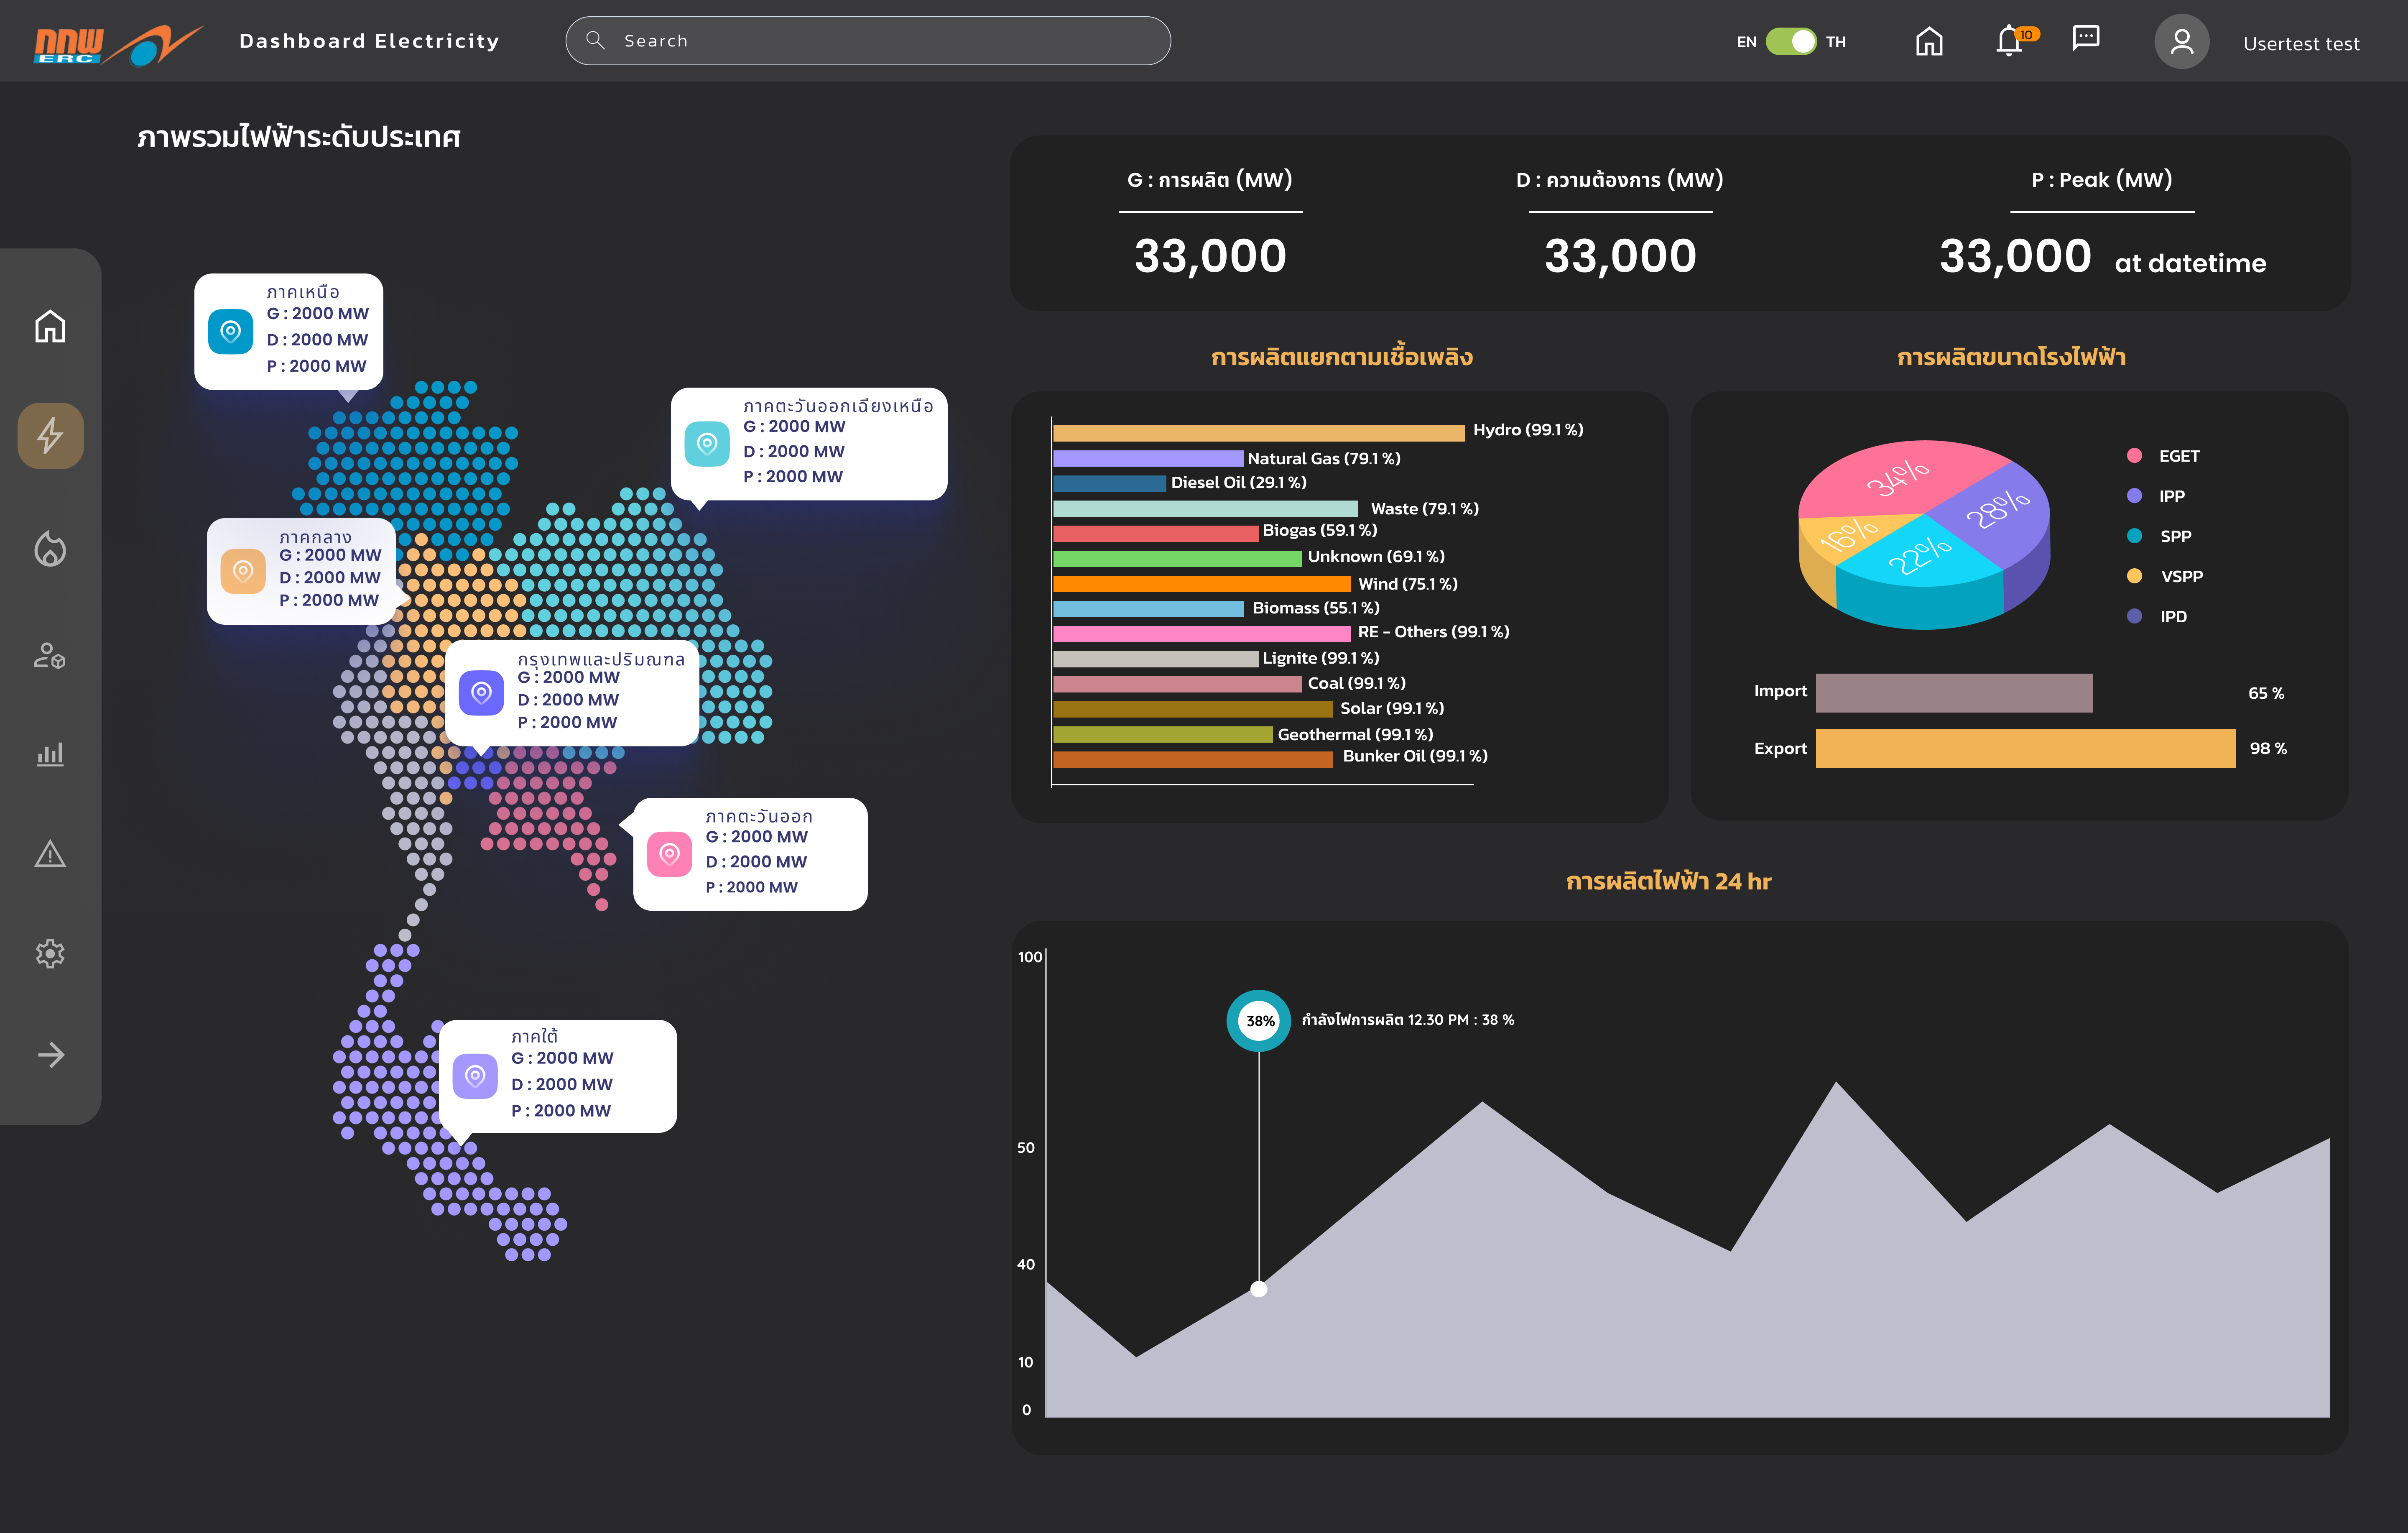
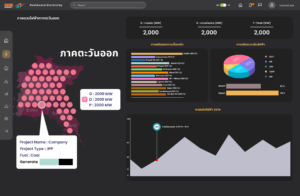
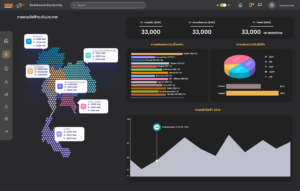
- With various pie charts and flow diagrams, the interface is designed to be highly visual and intuitive, offering a breakdown of key metrics such as total energy output (measured in GWh for electricity and BBTU/MMBTU for gas).
Task List for the ERC Dashboard Project
Phase 1: Initial Planning and Research
- Gather Requirements
- Collect detailed user requirements from the Energy Regulatory Commission (ERC) and other stakeholders.
- Define the scope of the project (e.g., types of data to be included, frequency of updates).
- Determine user roles and access levels (e.g., admin, viewer).
- Research Data Sources
- Identify and verify reliable data sources for gas and electricity supply information (e.g., from ERC, power plants, gas companies).
- Establish protocols for real-time data collection and integration into the dashboard.
- Design and Technology Stack Selection
- Select the appropriate tools and technologies for developing the dashboard (e.g., front-end technologies like React or Vue.js, backend frameworks like Node.js, and database systems).
- Design an initial wireframe or prototype of the dashboard to visualize data flow and user interaction.
Phase 2: Dashboard Development
- Develop Data Integration Pipelines
- Build or configure APIs to fetch data from different sources (e.g., gas suppliers, power plants, public electricity grids).
- Ensure data is updated in real-time or at appropriate intervals based on user needs.
- Frontend Development
- Create the dashboard interface according to the approved wireframe, including all required components (e.g., charts, data tables, graphs).
- Develop interactive visual elements, such as pie charts and flow diagrams, to display energy consumption, supply, and distribution data.
- Ensure the dashboard is responsive and accessible on different devices.
- Backend Development
- Set up the backend system to process, store, and manage energy data securely.
- Implement user authentication and access control for different user roles.
- Database Management
- Create databases to store historical energy data and ensure efficient querying for real-time dashboard updates.
- Set up regular backups and implement data validation to maintain accuracy.
Phase 3: Testing and Quality Assurance
- Testing Data Accuracy
- Ensure that all data displayed on the dashboard is accurate and correctly synchronized with data sources.
- Test various scenarios for different energy sources and supply changes (e.g., increases in gas imports or renewable energy production).
- User Experience (UX) Testing
- Conduct usability testing to ensure the dashboard is intuitive and easy to navigate.
- Gather feedback from initial users (ERC staff, energy providers) and make necessary adjustments.
- Performance and Load Testing
- Test the dashboard’s performance under various loads to ensure it can handle large data sets and multiple users without slowing down.
Phase 4: Deployment and Maintenance
- Launch Dashboard
- Deploy the dashboard on the selected platform (cloud or on-premise) and ensure it is accessible to all authorized users.
- Set up user training sessions to guide stakeholders on how to use the dashboard effectively.
- Post-Launch Support
- Monitor the dashboard for any performance or data-related issues post-launch.
- Provide ongoing support for feature updates, bug fixes, and system upgrades.
- Data Reporting & Insights
- Implement automated reporting features to generate energy consumption and supply summaries for key stakeholders.
- Add customizable features allowing users to filter and export specific data sets (e.g., electricity consumption by region).
Phase 5: Future Enhancements
- Energy Forecasting
- Integrate forecasting models to predict energy demand and supply trends based on historical data.
- Renewable Energy Optimization
- Explore the potential for including advanced features that emphasize renewable energy contributions and their impact on the national energy grid.
Solution:
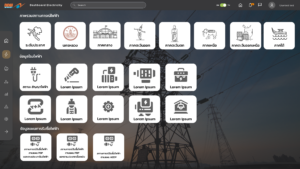
The ERC Dashboard will serve as a centralized, real-time platform for monitoring and managing Thailand’s electricity and natural gas supply. This solution will integrate data from various sources, including power plants, gas suppliers, and transmission lines, into one unified interface. The dashboard will feature interactive data visualizations, allowing users to track energy production, distribution, and consumption across multiple sectors and energy sources (e.g., renewable, non-renewable).
Key features include:
- Real-Time Data Monitoring: Provide up-to-date information on electricity and gas supply, demand, and distribution through live data feeds.
- Interactive Visualizations: Use intuitive charts and graphs to break down energy flows, consumption patterns, and renewable energy contributions, making complex data easy to understand.
- Instant Alerts and Notifications: Implement real-time alerts for critical events such as supply shortages, power outages, or equipment malfunctions.
- Automated Reporting: Generate tailored reports on energy consumption, renewable energy contributions, and grid performance for different user groups (e.g., analysts, executives).
- Load Balancing and Forecasting: Support efficient energy management by offering tools to balance loads between traditional and renewable energy sources and provide future energy demand forecasts.
- User Access Control: Ensure that data is accessible to different stakeholders based on their roles, from energy regulators to grid operators.
Design Research & Insights:
To create a highly effective ERC Dashboard for Thailand’s energy sector, it is crucial to conduct comprehensive design research. This will ensure the dashboard is not only visually intuitive but also functionally aligned with user needs and industry standards. The research approach will integrate both qualitative and quantitative methodologies to gather deep insights into the requirements, pain points, and workflows of various stakeholders.
1. Stakeholder Interviews
Objective: Gain insights from key users such as energy analysts, regulatory officers, and grid operators to understand their daily tasks, challenges, and expectations for the energy dashboard.
Key Insights:
- Energy Analysts: Require tools for easy comparison of data across time periods to identify trends in energy consumption and generation, with a focus on renewable energy integration.
- Regulatory Officers: Need real-time compliance monitoring and reporting tools for various departments, as well as insights into how energy production aligns with national sustainability goals.
- Electricity Operators: Demand immediate access to live data to ensure continuous operations and quick response to outages. Grid stability and load balancing between different energy sources are their top concerns.
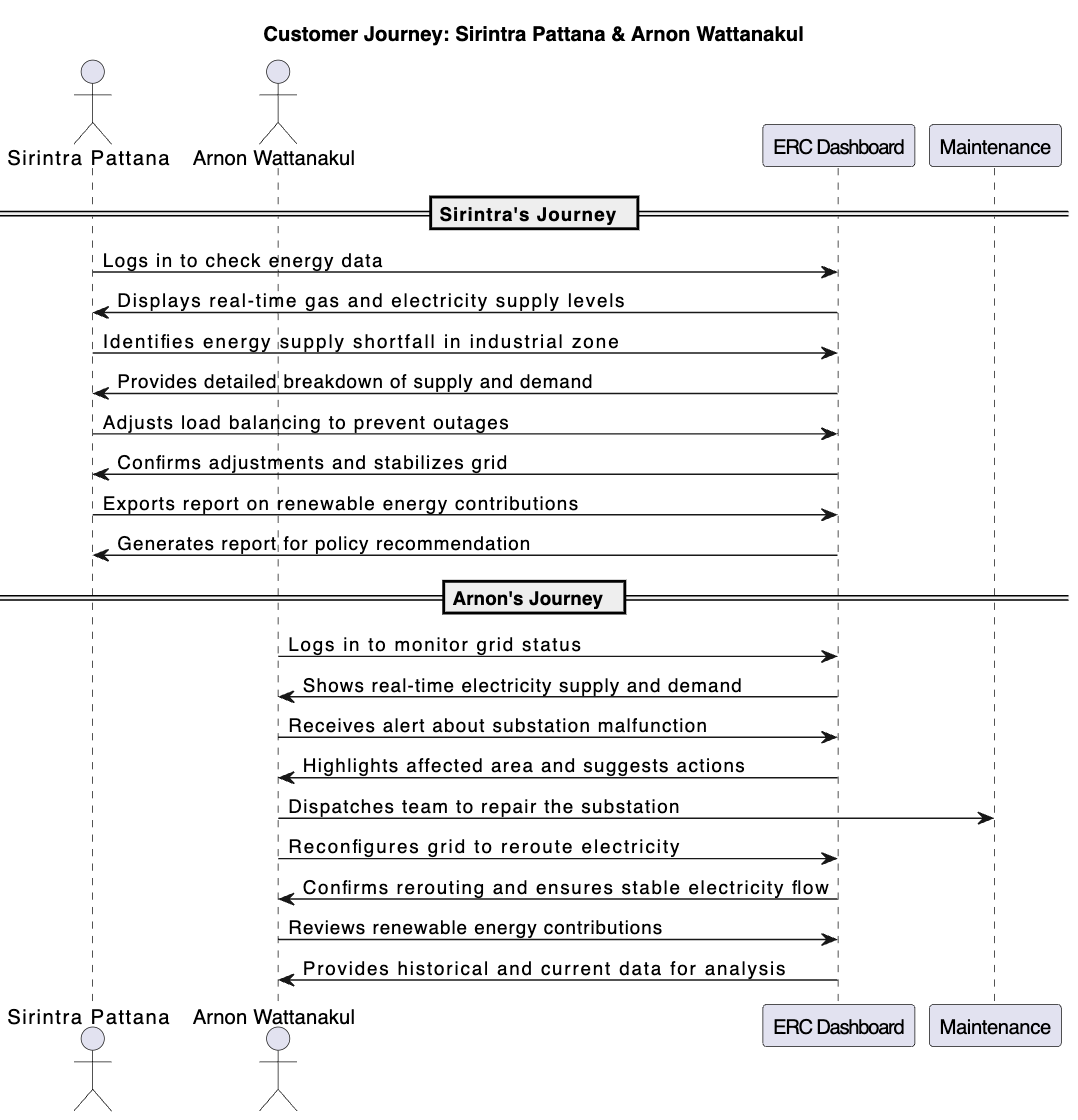
2. User Journey Mapping
Objective: Map out the workflows and challenges of different user personas, such as energy regulatory analysts and electricity operators, to identify pain points and opportunities for improvement.
Key Insights:
- Energy Analysts: Struggle with consolidating data from multiple sources, requiring manual effort to prepare reports and analyze trends. Delays in accessing real-time data affect decision-making, especially in forecasting demand or integrating renewables.
- Electricity Operators: Face inconsistent communication across departments, delaying responses to power outages. The fluctuating nature of renewable energy introduces instability in load balancing, making predictive tools and real-time monitoring essential.
3. Competitive Benchmarking
Objective: Analyze global energy management dashboards to identify best practices in UI/UX design, functionality, and features.
Key Insights:
- Best Practices: Leading dashboards feature interactive, real-time visualizations of energy supply, demand, and distribution, along with customizable views, multi-layered data visualizations, and critical system alerts.
- Areas for Improvement: Most dashboards lack effective forecasting tools and are too complex for non-technical users. Users desire simplified interfaces, intuitive navigation, and easy data export options.
4. Contextual Inquiry
Objective: Observe users in their natural work environment to understand how they currently access, interpret, and use energy data in decision-making.
Key Insights:
- Energy Analysts: Spend considerable time switching between software and data sources to compile reports. They need tools that enable quick access and interpretation of large datasets without manual manipulation.
- Electricity Operators: Often rely on multiple systems to track various aspects of energy distribution, leading to data silos. A unified platform displaying real-time data from different energy sources is critical for efficient decision-making.
5. Usability Testing (Prototypes)
Objective: Test dashboard prototypes with a sample group of target users to validate design decisions and identify usability challenges.
Key Insights:
- Navigation: Users prefer a clean, minimal interface with clear data categorization. Complex data should be broken down into actionable insights through visual cues like color-coded alerts.
- Customization: Users want customizable dashboards to prioritize relevant data for their roles. For instance, grid operators prefer real-time supply and demand data, while analysts focus on historical data and trends.
- Real-Time Alerts: Essential for operators, real-time notifications must be easy to access and provide clear instructions for immediate action (e.g., notifying maintenance teams about outages).
- Reports and Data Export: Analysts emphasize the need for simple data export tools to create custom reports for internal and external stakeholders.
6. Quantitative Surveys
Objective: Collect broad, quantitative data from a larger pool of users across energy companies and regulatory bodies to identify key functionality and feature requirements.
Key Insights:
- Real-Time Data Access: 87% of respondents stated that real-time energy data was critical to operations, with 72% indicating delays in data access impacted decision-making.
- Energy Source Breakdown: 65% of users wanted clearer differentiation between traditional and renewable energy sources to track their contributions to the grid.
- Automated Reporting: 80% of regulatory officers reported that automated reporting tools would significantly enhance their workflows, especially when reporting to government agencies or presenting to senior management.
7. Environmental and Regulatory Context Research
Objective: Understand the regulatory landscape and sustainability goals within Thailand’s energy sector to ensure the dashboard aligns with national energy policies and environmental objectives.
Key Insights:
- Sustainability Focus: Thailand aims for 30% of its energy to come from renewables by 2036. The dashboard must clearly highlight renewable energy’s role in meeting these sustainability targets.
- Compliance Monitoring: Regulatory bodies need tools to monitor compliance with environmental regulations and track progress toward carbon reduction goals.
Actionable Design Insights:
- Real-Time Data and Alerts: Prioritize real-time data visualization and instant alerts to meet the operational needs of electricity operators, allowing for faster response times and improved grid stability.
- Simplified Reporting Tools: Provide automated report generation and easy data export features, especially for energy analysts and regulatory officers who require comprehensive reporting.
- Customizable Interface: Implement customizable dashboards where users can prioritize the data most relevant to their role, improving their efficiency and decision-making capabilities.
- Renewable Energy Focus: Highlight renewable energy contributions in clear, color-coded charts and ensure that the dashboard tracks their integration into the national grid.
- User-Centric Design: Ensure a simple and intuitive UI/UX, focusing on ease of navigation, clear visualizations, and minimizing information overload for users who may not have technical backgrounds.
Persona


Process & Approach
- Discovery & Research
- Conduct user research through interviews, surveys, and competitive analysis to gather insights into user needs, behaviors, and pain points.
- Analyze existing products and business goals to align design strategy with the overall vision.
- Define & Ideate
- Create personas, user journey maps, and problem statements to clearly define user goals and challenges.
- Brainstorm and generate ideas for solving user pain points, focusing on usability and simplicity.
- Wireframing & Prototyping
- Develop low-fidelity wireframes to visualize the structure and layout of the solution.
- Create high-fidelity interactive prototypes using tools like Figma or Adobe XD, allowing stakeholders and users to test the product early in the design process.
- User Testing & Validation
- Conduct usability testing to gather feedback on the prototypes and identify areas for improvement.
- Iterate on designs based on user feedback, refining interactions and user flows to ensure optimal user experience.
- Design Handoff & Implementation
- Collaborate closely with developers to ensure the design is implemented correctly, providing detailed specifications and assets.
- Maintain open communication throughout the development process, adjusting designs as needed for technical feasibility.
- Review & Iterate
- After product launch, monitor user interactions and gather analytics to assess performance.
- Use data-driven insights to make further improvements, ensuring continuous enhancement of the user experience.
Design Overview
Results & Impact:
- Increased Operational Efficiency:
- Reduced manual work: Automated data collection and reporting will eliminate the need for manual compilation, allowing energy analysts and operators to focus on high-priority tasks.
- Improved coordination: Instant notifications and real-time monitoring will allow faster communication and coordination between different teams (generation, distribution, and maintenance).
- Enhanced Decision-Making:
- Data-driven insights: Access to real-time and historical data, combined with interactive visualizations, will enable stakeholders to make quicker, more informed decisions.
- Load balancing: The ability to dynamically balance energy supply from traditional and renewable sources will reduce strain on the grid and optimize resource usage.
- Increased Grid Reliability:
- Proactive maintenance: Predictive tools using historical data will help prevent outages by identifying potential infrastructure failures before they occur.
- Faster response times: Real-time alerts and fault detection will allow electricity operations officers to respond quickly to disruptions, minimizing downtime.
- Support for Renewable Energy Goals:
- Sustainable energy management: The dashboard will track the contribution of renewable energy sources (e.g., wind, solar) and help energy regulators and operators adjust energy flows accordingly.
- Forecasting: Accurate forecasting tools will help predict energy demand and supply, supporting the integration of renewable energy without compromising grid stability.
- Improved Regulatory Oversight:
- Compliance monitoring: Energy regulators will have a clear view of energy production, consumption, and distribution patterns, allowing them to ensure compliance with national energy policies and sustainability goals.
- Strategic reporting: Tailored reports for stakeholders (e.g., government, private sector) will help drive policy decisions and strategic investments in energy infrastructure.
Impact Summary:
The ERC Dashboard will transform the way Thailand’s energy sector operates by providing a robust, real-time platform for energy management. This will result in:
- Greater energy efficiency through optimized resource allocation and reduced operational bottlenecks.
- Increased grid stability, with fewer outages and quicker responses to supply issues.
- Support for national energy sustainability goals, including the integration of renewable energy into the grid.
- Informed regulatory decisions, driven by data-backed insights and improved reporting.
Conclusion
The ERC Dashboard serves as a critical platform for monitoring, managing, and regulating energy production and distribution in Thailand. It is designed to streamline the workflows of various stakeholders such as energy regulatory analysts and electricity operations officers. The dashboard integrates real-time data on natural gas and electricity supplies, offering comprehensive visualizations that allow users to make data-driven decisions and respond to changes efficiently.
Key functions of the ERC Dashboard include:
- Real-Time Monitoring: The dashboard provides real-time insights into the status of energy production, supply, and consumption, allowing stakeholders to ensure grid stability and optimal resource allocation.
- Interactive Data Visualizations: Complex data from various energy sources, both renewable and non-renewable, are presented in an easy-to-understand format, enabling quick analysis and decision-making.
- Load Balancing and Grid Management: The system helps manage the balance between different energy sources and supports the integration of renewable energy into the national grid, ensuring a smooth transition to a more sustainable energy infrastructure.
- Alerts and Notifications: Users receive instant notifications regarding critical events, such as energy shortages or grid malfunctions, allowing for quick action and minimization of downtime.
- Reporting and Compliance: The dashboard simplifies the process of generating detailed reports, which are essential for regulatory oversight and strategic planning, especially in meeting Thailand’s energy sustainability goals.
The ERC Dashboard is an indispensable tool in enhancing operational efficiency, improving the reliability of energy services, and supporting the long-term transition toward renewable energy. By consolidating vital energy data in one platform, it empowers energy regulators, grid operators, and policy-makers to make informed decisions that ensure energy security and sustainability across the country.
